

Unlocking Team Potential: The Power of Employee Engagement KPIs
Want a high-performing team? You need to measure employee engagement. This listicle reveals eight essential employee engagement KPIs to help you build a thriving workforce. Learn how to track metrics like employee Net Promoter Score (eNPS), turnover rate, absenteeism, and more. By understanding these key indicators, you can pinpoint areas for improvement, boost employee satisfaction, and drive organizational success. Discover how the right employee engagement KPIs empower data-driven decisions and build a stronger, more engaged team.
1. Employee Net Promoter Score (eNPS)
Employee Net Promoter Score (eNPS) is a widely used employee engagement KPI that gauges employee loyalty and satisfaction by measuring how likely they are to recommend their workplace to others. It serves as a valuable tool for organizations seeking to understand employee sentiment and predict potential advocacy or detracting behavior. Its simplicity and ease of implementation have made it a popular choice for businesses of all sizes, allowing them to quickly assess workforce morale and identify areas for improvement. This makes eNPS a deserving first entry in any list of essential employee engagement KPIs.
The eNPS methodology is straightforward. Employees are asked a single question: "On a scale of 0 to 10, how likely are you to recommend this company as a place to work?" Based on their responses, employees are categorized into three groups:
- Promoters (9-10): These are your most enthusiastic employees, highly satisfied with their work and likely to act as brand ambassadors. They actively contribute to a positive work environment and drive business growth.
- Passives (7-8): These employees are generally content but not overly enthusiastic. They are susceptible to being swayed by competitors and may not actively promote the company.
- Detractors (0-6): These employees are dissatisfied with their work experience and are likely to share negative feedback, potentially damaging the company's reputation.
The eNPS score is calculated by subtracting the percentage of detractors from the percentage of promoters. Passives are not included in the calculation. This results in a score ranging from -100 to +100. A higher score indicates a greater level of employee satisfaction and loyalty.
One of eNPS's greatest strengths lies in its simplicity. The single-question format ensures high response rates and makes it easy to track trends over time. Its clear scoring system provides a benchmark for improvement and allows for easy comparison against industry standards. Furthermore, eNPS can be segmented by department, tenure, or demographics to pinpoint specific areas of concern.
However, eNPS also has its limitations. It oversimplifies complex employee sentiment, potentially missing nuanced feedback. Cultural differences can influence scoring patterns, and recent events or biases can also skew results. While eNPS highlights potential issues, it doesn't provide specific actionable insights.
Despite these limitations, the benefits of eNPS are significant. It provides a quick pulse check on employee morale, facilitates transparent communication, and allows organizations to proactively address potential issues. Companies like Apple, Zappos, and Microsoft have successfully leveraged eNPS to drive cultural transformation and improve employee engagement. Apple maintains an eNPS of +72, significantly above the technology industry average of +31. Zappos uses eNPS quarterly and correlates it with customer satisfaction scores. Microsoft's eNPS journey, which saw an improvement from +10 to +77 following cultural transformation initiatives, is a testament to the power of eNPS as a driver of positive change.
To illustrate a typical eNPS calculation, let's consider a hypothetical scenario visualized in the infographic below.
The following infographic visualizes the percentage of Promoters and Detractors, which are used to calculate the eNPS.
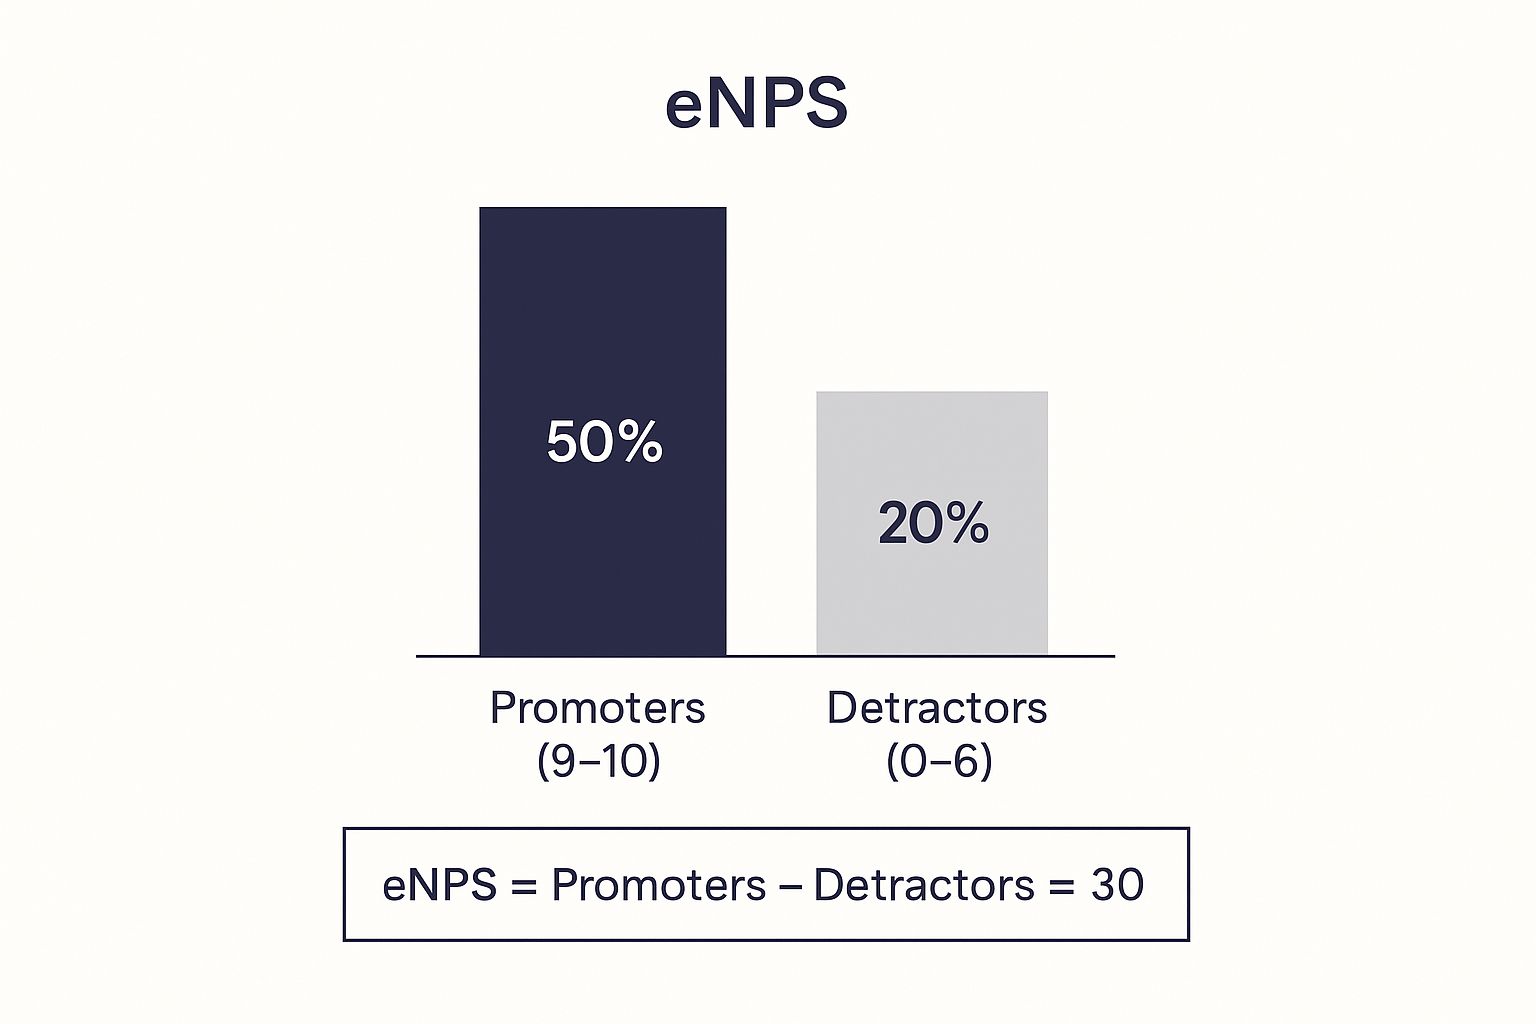
As the infographic demonstrates, subtracting the percentage of Detractors (20%) from the percentage of Promoters (50%) results in an eNPS of 30. This visualization clearly demonstrates the core calculation behind the eNPS metric and highlights the importance of maximizing Promoters while minimizing Detractors.
To effectively utilize eNPS as an employee engagement KPI, consider these tips:
- Regular Surveys: Survey quarterly to track trends without causing survey fatigue.
- Follow-Up Questions: Include open-ended questions to gather qualitative feedback and understand the "why" behind the scores.
- Segmentation: Analyze results by department, tenure, or demographics to identify specific problem areas.
- Transparency: Share results transparently with employees to build trust and foster a culture of open communication.
- Action Planning: Develop action plans based on feedback and communicate progress to demonstrate commitment to improvement.
By following these best practices and understanding the strengths and weaknesses of eNPS, organizations can effectively leverage this valuable metric to improve employee engagement, foster a positive work environment, and ultimately drive business success.
2. Employee Turnover Rate
Employee turnover rate is a critical employee engagement KPI that measures the percentage of employees who leave an organization within a specific timeframe, typically a year. It serves as a valuable barometer of workforce stability, employee satisfaction, and the overall health of your organizational culture. By tracking and analyzing turnover rates, businesses can gain crucial insights into potential problem areas and implement targeted interventions to improve employee retention and, ultimately, their bottom line. This KPI encompasses both voluntary departures (resignations) and involuntary separations (terminations), providing a holistic view of employee attrition. Understanding the nuances of your turnover rate – including the reasons behind employee departures – is essential for creating a thriving and engaging work environment. This is why it deserves a prominent place in any list of key employee engagement KPIs.

The calculation is straightforward: (Number of departures / Average number of employees) × 100. For instance, if a company with an average of 500 employees experiences 50 departures in a year, the turnover rate is (50/500) × 100 = 10%. This seemingly simple metric provides a wealth of information when analyzed further. It can be segmented into voluntary vs. involuntary turnover, offering a more granular understanding of the drivers behind employee departures. Furthermore, it can be measured by department, role level, or tenure, allowing organizations to pinpoint specific areas experiencing high attrition.
The impact of employee turnover extends beyond just numbers; it directly affects recruitment and training costs, impacting the overall financial health of the organization. A high turnover rate can signify deeper issues within the organizational culture and management practices. Conversely, a healthy turnover rate often indicates a positive and engaging work environment.
Benefits of Tracking Employee Turnover Rate:
- Clear financial impact measurement: Calculating the cost of turnover (including recruitment, onboarding, and lost productivity) provides a tangible financial justification for retention initiatives.
- Easy to calculate and track historically: The simplicity of the calculation allows for easy tracking over time, facilitating trend analysis and the identification of patterns.
- Industry benchmarks readily available: Comparing your turnover rate with industry averages helps contextualize your performance and identify areas for improvement.
- Identifies retention problem areas: By segmenting turnover data, you can pinpoint specific departments, roles, or demographics experiencing higher-than-average attrition.
- Directly linked to business outcomes: Improved retention directly correlates with increased productivity, improved morale, and enhanced customer satisfaction.
Challenges and Considerations:
- Lagging indicator: Turnover rate reveals existing problems rather than predicting them, making proactive intervention challenging.
- Doesn't differentiate between high and low performers: The metric doesn't distinguish between the departure of valuable employees versus those who were underperforming.
- Industry variations in benchmarking: Benchmarking can be complex due to significant variations in turnover rates across different industries.
- Seasonal fluctuations: Seasonal hiring patterns can skew the data, requiring careful interpretation.
- May not reflect the quality of the remaining workforce: A low turnover rate doesn't necessarily indicate a high-performing workforce.
Examples of Successful Implementation:
- Google maintains a turnover rate significantly lower than the tech industry average, highlighting their success in creating an engaging and rewarding work environment.
- The Ritz-Carlton drastically reduced their turnover through focused employee engagement initiatives, demonstrating the powerful impact of investing in employee well-being.
- Salesforce maintains a low voluntary turnover rate through comprehensive employee development programs, emphasizing the importance of career growth opportunities in retaining talent.
Actionable Tips for Leveraging Employee Turnover Rate:
- Track voluntary turnover separately: Voluntary turnover is more actionable as it often reflects employee satisfaction and engagement levels.
- Conduct exit interviews: Gaining insights into the reasons behind employee departures can help identify areas for improvement and prevent future attrition.
- Calculate turnover costs: Quantifying the financial impact of turnover strengthens the case for investing in retention strategies.
- Monitor new hire turnover rates (first 90 days) separately: High early turnover can indicate issues with onboarding or the recruitment process.
- Set department-specific targets based on industry benchmarks: Tailoring targets to specific departments ensures a more relevant and effective approach to retention.
Learn more about Employee Turnover Rate
For HR professionals, business executives, team managers, and anyone invested in fostering a thriving organizational culture, understanding and actively monitoring employee turnover rate is an indispensable tool for building a more engaged and productive workforce. By utilizing this KPI effectively, organizations can gain a deeper understanding of their workforce dynamics and implement impactful strategies to cultivate a positive and rewarding work environment. This, in turn, drives better business outcomes and contributes to long-term organizational success. This makes employee turnover rate a vital component of any comprehensive employee engagement KPI strategy.
3. Employee Absenteeism Rate
Employee absenteeism rate is a crucial employee engagement KPI that measures the frequency of unplanned employee absences. It's calculated as the percentage of scheduled workdays missed due to illness, personal issues, or other unexcused reasons. While seemingly straightforward, this metric offers valuable insights into the overall health and engagement of your workforce. High absenteeism often signals underlying issues like low engagement, potential health problems, or widespread workplace dissatisfaction. Tracking and analyzing this KPI can help organizations proactively address these concerns and foster a more productive and positive work environment. This makes it a valuable tool for HR professionals, business leaders, and anyone invested in cultivating a thriving organizational culture.

The calculation itself is simple: (Days absent / Total scheduled workdays) × 100. It's important to note that this metric specifically excludes planned vacation time and approved leaves of absence, focusing solely on unplanned absences. This allows you to isolate and address the root causes of unscheduled time off. The data can be further analyzed by tracking patterns related to the day of the week, season, or specific departments. This granular approach can reveal trends and pinpoint areas needing attention. For example, consistently high absenteeism on Mondays in a particular department might suggest a morale issue or a challenging project impacting that team.
This KPI deserves its place on any employee engagement list because it directly correlates with employee wellbeing and job satisfaction. These factors are inherently linked to productivity and overall team morale. By monitoring absenteeism, businesses can identify early warning signs of deeper engagement problems and implement timely interventions.
Features and Benefits:
- Easy Tracking: Most existing HR systems readily track attendance data, making this KPI easy to monitor.
- Pattern Identification: Analyzing absence data helps identify patterns and potential underlying issues impacting specific teams or departments.
- Productivity Correlation: Absenteeism directly impacts productivity, providing a clear link between this KPI and business outcomes.
- Wellness Program Justification: Tracking absenteeism can justify investments in wellness programs by demonstrating their impact on employee health and attendance.
Pros:
- Early Indicator: Provides an early warning signal of potential engagement or wellbeing issues.
- Easy to Track: Readily accessible data through existing HR systems.
- Identifies Patterns: Reveals trends and potential problems related to specific days, seasons, or departments.
- Direct Correlation: Directly linked to productivity metrics and overall business performance.
- Justifies Investments: Supports investments in wellness programs and other employee support initiatives.
Cons:
- External Factors: Absenteeism can be influenced by factors outside the employer's control, such as family emergencies or community health issues.
- Seasonal Variations: Flu season, school schedules, and holidays can introduce seasonal variations in absenteeism rates.
- Potential for Penalty: May inadvertently penalize employees with legitimate health concerns.
- Cultural Differences: Cultural norms around taking time off can influence absenteeism rates.
- Presenteeism: Doesn't account for presenteeism – employees who are physically present but unproductive due to illness or other issues.
Successful Implementation Examples:
- Johnson & Johnson reduced employee absenteeism by 18% through comprehensive wellness programs focusing on preventative care and employee well-being.
- 3M tracks absenteeism alongside safety metrics and identified a strong correlation, leading to improved safety protocols and reduced lost time due to injuries.
- Virgin Group implemented flexible work policies that resulted in a 30% reduction in unplanned absences, demonstrating the positive impact of work-life balance on employee attendance.
Actionable Tips for Utilizing Absenteeism Rate:
- Track the Bradford Factor: This metric (frequency × frequency × duration) helps identify patterns in employee absences, highlighting frequent short-term absences that might indicate underlying issues.
- Conduct Return-to-Work Interviews: These interviews can help understand the reasons for absences and identify any workplace stressors or support needs.
- Offer Employee Assistance Programs (EAPs): EAPs provide confidential counseling and support services to address personal or work-related issues contributing to absenteeism.
- Analyze Absence Patterns: Regularly analyze absence data to identify trends related to specific teams, departments, or time periods.
- Implement Flexible Work Arrangements: Offering flexible work options can reduce stress-related absences and improve work-life balance.
By strategically monitoring and analyzing employee absenteeism rates, organizations can gain valuable insights into employee engagement, wellbeing, and overall organizational health. Using this KPI in conjunction with other engagement metrics provides a comprehensive picture of the employee experience and empowers businesses to proactively address potential problems and create a more productive and positive work environment.
4. Internal Promotion Rate
Internal promotion rate, a key employee engagement KPI, measures the percentage of leadership and key positions filled by internal candidates compared to external hires. This metric provides valuable insights into an organization's commitment to employee development, the effectiveness of its talent retention strategies, and the strength of its succession planning. Tracking and analyzing internal promotion rates can significantly contribute to a more engaged and motivated workforce, which in turn drives productivity and business success. This makes it a crucial metric for HR professionals, People Leaders, Business Executives, and anyone involved in shaping company culture.
How It Works and Why It Matters
The internal promotion rate is calculated by dividing the number of internal promotions by the total number of positions filled, then multiplying the result by 100. This straightforward calculation reveals much about a company's internal mobility and opportunities for growth. A high internal promotion rate generally suggests that an organization invests in its employees' development, offers clear career paths, and values internal talent. This contributes significantly to employee engagement because it demonstrates that hard work and dedication are rewarded with opportunities for advancement within the company. Conversely, a low internal promotion rate can indicate a lack of development opportunities, potentially leading to decreased employee morale, higher turnover, and difficulty attracting top talent.
The Benefits of Prioritizing Internal Promotions
Promoting from within offers a multitude of benefits, contributing to both employee engagement and organizational success. For employees, it signifies that career progression is attainable within the company, fostering a sense of loyalty and motivation. It also allows them to leverage their existing knowledge of the company culture and processes, leading to a quicker onboarding process and faster time-to-productivity in the new role. For organizations, internal promotions reduce recruitment costs, shorten time-to-fill for open positions, and preserve institutional knowledge. Moreover, it strengthens the employer brand, attracting top talent who seek growth opportunities, and encourages employee referrals, often leading to higher quality hires.
Examples of Successful Implementation
Several prominent companies have successfully leveraged internal promotions to build strong, engaged workforces and robust leadership pipelines. IBM, for instance, fills approximately 60% of its management positions internally through its dedicated leadership development programs, fostering a culture of continuous learning and advancement. Starbucks, known for its "partner-first" culture, promotes around 70% of its managers from within, demonstrating a clear commitment to its employees’ growth. Historically, General Electric, under the leadership of Jack Welch, achieved an impressive 85% internal promotion rate for executive positions, creating a formidable leadership pipeline and a highly engaged workforce. These examples showcase the power of prioritizing internal promotions as a core component of talent management.
Actionable Tips for Implementing and Tracking Internal Promotion Rate
To effectively leverage internal promotion rate as an employee engagement KPI, consider these actionable tips:
- Set realistic targets: Aiming for an internal promotion rate between 60-70% often strikes a balance between promoting from within and bringing in external perspectives.
- Invest in employee development: Implement robust Individual Development Plans (IDPs) for high-potential employees to equip them with the skills and knowledge needed for advancement.
- Foster mentorship and coaching: Create mentorship and coaching programs to guide employees’ career development and prepare them for leadership roles.
- Provide cross-functional opportunities: Offer cross-functional project opportunities to broaden employees’ skillsets and experience.
- Communicate transparently: Clearly communicate promotion criteria and career paths to ensure transparency and fairness.
- Track by department and level: Monitor internal promotion rates by department and management level to identify areas for improvement and ensure equitable opportunities across the organization.
Pros and Cons of Focusing on Internal Promotions
While prioritizing internal promotions offers numerous benefits, it’s essential to acknowledge the potential drawbacks. Over-reliance on internal promotions can limit the influx of fresh perspectives and innovative ideas that external hires often bring. It can also create internal competition and potentially lead to office politics. Furthermore, investing in employee development programs requires significant resources, and there's always a risk of promoting individuals beyond their competency levels. Finally, relying solely on internal promotions may not adequately address specific skill gaps that require specialized external expertise.
By carefully considering these pros and cons, organizations can develop a balanced approach to talent management that leverages the benefits of internal promotions while mitigating potential risks. Using internal promotion rate as a key employee engagement KPI allows companies to cultivate a motivated workforce, build a strong leadership pipeline, and drive long-term organizational success.
5. Employee Satisfaction Score
Employee satisfaction score is a crucial employee engagement KPI that gauges the overall contentment of your workforce with various aspects of their work experience. This metric provides a holistic view of how employees perceive their roles, the company culture, and the organization as a whole. It plays a vital role in understanding the overall health of your organization and identifying areas for improvement, ultimately impacting key business outcomes like productivity, retention, and profitability. By measuring employee satisfaction, businesses gain valuable insights into what truly motivates and engages their workforce, allowing them to create a more positive and productive environment. This, in turn, contributes to a stronger employer brand and enhances the organization's ability to attract and retain top talent.
Employee satisfaction is typically measured through comprehensive surveys using Likert scales (e.g., 1-5 or 1-7, strongly disagree to strongly agree) to quantify responses. These surveys encompass a multi-dimensional range of workplace factors, including:
- Compensation and benefits: Fairness of salary, benefits package, and perceived value.
- Work environment: Physical workspace, resources, and overall atmosphere.
- Management and leadership: Quality of supervision, communication, and leadership style.
- Career development: Opportunities for growth, training, and advancement.
- Work-life balance: Ability to manage work responsibilities alongside personal life.
By collecting data across these various dimensions, organizations gain a comprehensive understanding of employee experience. This allows for a more nuanced analysis, pinpointing specific strengths and weaknesses within the workplace. For instance, a company might discover high satisfaction with compensation but low satisfaction with career development opportunities, enabling them to focus their improvement efforts strategically.
The employee satisfaction score offers several key features that make it a powerful tool for measuring employee engagement:
- Multi-dimensional measurement: Covering various aspects provides a holistic picture.
- Scalable measurement: Standardized scales facilitate comparison and tracking over time.
- Granular analysis: Data can be broken down by department, team, demographics, or tenure for targeted interventions.
- Benchmarking: Results can be compared against industry standards to assess competitive positioning.
- Correlation with other metrics: Employee satisfaction often correlates with productivity, retention, and customer satisfaction metrics.
Using employee satisfaction as a KPI offers numerous advantages:
Pros:
- Comprehensive view of employee experience: Provides a broad understanding of what drives engagement and disengagement.
- Identifies specific areas for improvement: Pinpoints precise areas requiring attention and resources.
- Strong predictor of turnover intentions: Helps anticipate and mitigate potential attrition.
- Helps prioritize HR initiatives and budgets: Data-driven insights enable strategic allocation of resources.
- Demonstrates organizational commitment to employee welfare: Shows employees that their opinions and well-being are valued.
Cons:
- Survey fatigue: Overly frequent surveys can lead to lower response rates and less accurate data.
- Influence of recent events: Responses can be swayed by immediate circumstances, potentially skewing overall trends.
- Response bias: Some individuals may tend towards extreme positive or negative responses.
- Time investment: Completing surveys requires time and effort from employees.
- Cultural differences: Response patterns may vary across different cultural contexts.
To effectively utilize employee satisfaction scores within your organization, consider these tips:
- Conduct annual comprehensive surveys with quarterly pulse checks: Balance in-depth analysis with regular feedback.
- Use consistent questions to track trends over time: Maintain consistent metrics for accurate comparison.
- Ensure anonymity and communicate confidentiality clearly: Foster trust and encourage honest feedback.
- Act on results and communicate changes made: Demonstrate that feedback is taken seriously.
- Compare results across departments and demographics: Identify and address specific needs within different groups.
Learn more about Employee Satisfaction Score
Popularized by organizations like Gallup, Culture Amp, and Great Place to Work Institute, tracking employee satisfaction provides invaluable insights into the overall health of your organization. By actively monitoring and addressing employee satisfaction, businesses can cultivate a more engaged, productive, and thriving workforce. This KPI deserves its place on any list of essential employee engagement metrics because it speaks directly to the heart of the employee experience, providing a clear indicator of overall well-being and a roadmap for creating a more positive and productive work environment.
6. Manager Effectiveness Score
Among the most critical employee engagement KPIs is the Manager Effectiveness Score. This metric evaluates how effectively managers lead, develop, and engage their teams, providing valuable insights into a crucial driver of overall employee engagement. It recognizes the widely held belief that employees primarily leave managers, not companies, making leadership quality a cornerstone of any successful engagement strategy. Thus, understanding and improving manager effectiveness is vital for boosting employee morale, productivity, and retention. This KPI deserves its place on this list because it directly addresses a primary source of disengagement and provides a clear path towards building stronger, more engaged teams.
The Manager Effectiveness Score works by combining various data points to paint a comprehensive picture of a manager's impact. These typically include upward feedback from team members, peer reviews from fellow managers, and objective team performance metrics. This multi-faceted approach ensures a balanced and nuanced assessment, moving beyond subjective opinions to include quantifiable results. The KPI measures key aspects of leadership such as communication clarity and effectiveness, employee development and mentorship, frequency and quality of recognition, and the level of support provided to team members. By linking these managerial behaviors to team engagement outcomes, organizations can identify specific areas for improvement and develop targeted interventions.
One of the primary benefits of tracking this KPI is the ability to identify both high-performing and struggling managers. This allows organizations to recognize and reward exemplary leadership, while also providing targeted support and development opportunities for those who need it. By sharing best practices from top performers and addressing the specific challenges faced by others, companies can elevate the overall quality of leadership across the organization. This, in turn, creates a ripple effect, boosting team performance, improving employee retention, and fostering a culture of engagement.
Several organizations have successfully implemented manager effectiveness programs, demonstrating the tangible benefits of this approach. Google's Project Oxygen, for instance, identified eight key manager behaviors that significantly improve team performance, including empowering team members, expressing interest in their well-being, and creating a psychologically safe environment. Facebook's semi-annual manager feedback process has led to a reported 25% improvement in team satisfaction, highlighting the power of regular feedback loops. Similarly, Netflix's ingrained culture of 360-degree feedback fosters a high-accountability leadership environment where continuous improvement is expected and supported. Learn more about Manager Effectiveness Score to see how these initiatives impact engagement.
While the benefits are significant, implementing a Manager Effectiveness Score requires careful planning and execution. One potential drawback is the need for a culture of trust and transparency to effectively handle upward feedback. In organizations where open communication isn't the norm, there may be initial resistance or defensiveness from managers, particularly if they are unaccustomed to receiving direct feedback from their team members. Furthermore, it’s crucial to address any fears of retaliation, ensuring that feedback mechanisms are anonymous and confidential. Gathering comprehensive feedback can also be time-intensive, and organizations must be prepared to invest the necessary resources to collect, analyze, and act upon the data. Finally, simply measuring manager effectiveness isn't enough. Organizations must provide follow-up development and coaching support to help managers translate feedback into actionable improvements.
To successfully implement a Manager Effectiveness Score as one of your employee engagement KPIs, consider these actionable tips:
- Start small: Begin with manager self-assessments before introducing upward feedback to allow managers to reflect on their own strengths and weaknesses.
- Provide training: Equip managers with the skills to receive and act on feedback constructively, focusing on growth and development rather than defensiveness.
- Ensure anonymity: Utilize anonymous feedback platforms to encourage honest and candid responses from team members.
- Link to performance: Connect manager effectiveness scores to performance reviews, promotion decisions, and even compensation, demonstrating the value placed on strong leadership.
- Offer development resources: Provide access to coaching, mentorship programs, and leadership development resources to help managers improve their skills and address areas for growth.
By following these tips, organizations can effectively leverage the Manager Effectiveness Score to drive positive change, cultivate a strong leadership pipeline, and significantly boost employee engagement. Popularized by influential sources like Google's People Operations team, the book First, Break All the Rules by Marcus Buckingham, and Gallup's extensive manager research studies, this KPI is recognized as a vital component of a comprehensive employee engagement strategy. By focusing on improving the quality of management, organizations can create a more engaged, productive, and ultimately, successful workforce.
7. Employee Recognition Frequency
Employee recognition frequency, a key employee engagement KPI, measures how often employees receive acknowledgment for their contributions, efforts, and achievements. This metric goes beyond formal awards ceremonies and encompasses both structured recognition programs and informal day-to-day appreciation. Tracking and analyzing employee recognition frequency is crucial because regular, meaningful recognition significantly impacts employee engagement, motivation, retention, and overall performance. It's a powerful tool for building a positive and productive workplace culture. This KPI deserves its place on this list because it represents a relatively inexpensive yet highly effective lever for driving positive change within an organization.
This KPI works by systematically tracking the number of recognition events per employee within a given timeframe. It should encompass various forms of recognition, including peer-to-peer acknowledgements, manager-to-employee appreciation, and formal company-wide programs. To gain a more granular understanding, the data can be segmented by recognition type, department, team, and even individual contributor. By linking recognition patterns to other engagement and performance metrics, organizations can gain valuable insights into the effectiveness of their recognition efforts and identify areas for improvement. For example, correlating recognition frequency with employee turnover rates can reveal the impact of appreciation on retention. Similarly, analyzing recognition patterns alongside performance data can highlight the link between acknowledgment and productivity.
Several features distinguish a robust employee recognition frequency program. It tracks not just the number of recognition events but also their quality and distribution. This includes distinguishing between different types of recognition, such as informal verbal praise, written thank-you notes, peer-to-peer bonus points, formal awards, and public acknowledgements. Furthermore, a comprehensive system allows for segmentation by department, team, or individual, enabling managers to identify potential disparities in recognition distribution and address any imbalances. The ability to link recognition patterns with engagement and performance metrics, such as employee surveys and productivity data, allows organizations to measure the impact of their recognition efforts and optimize their strategies.
Numerous organizations have successfully implemented employee recognition programs and reaped significant benefits. Zappos, known for its vibrant company culture, has a thriving peer-to-peer recognition program that generates over 1,000 recognitions monthly. Salesforce, a leading CRM platform provider, uses its own recognition platform and reports that 89% of employees feel valued when recognized. Southwest Airlines, consistently ranked high for employee satisfaction, attributes its success, in part, to its deeply ingrained culture of appreciation. These examples demonstrate the tangible positive impact of prioritizing recognition on employee engagement and overall organizational success.
Implementing an effective employee recognition program requires a strategic approach. Here are some actionable tips for HR professionals and business leaders:
- Aim for weekly recognition touchpoints for each employee: Regular, consistent recognition reinforces positive behaviors and builds a culture of appreciation.
- Train managers on specific, timely recognition techniques: Managers should be equipped to provide specific, meaningful feedback tied to individual accomplishments and company values.
- Implement peer-to-peer recognition platforms: These platforms empower employees to recognize each other's contributions, fostering a sense of camaraderie and teamwork.
- Tie recognition to company values and specific behaviors: This ensures that recognition is aligned with organizational goals and reinforces desired actions.
- Track recognition patterns to ensure equitable distribution: Regularly analyze the data to identify any biases or imbalances in recognition and take corrective action to ensure fairness and inclusivity.
While the benefits are substantial, organizations should be mindful of the potential downsides. If recognition becomes routine or perceived as insincere, it can lose its impact. Unequal distribution of recognition can create resentment and demotivate employees. Focusing solely on the quantity of recognition rather than the quality can also diminish its effectiveness. Furthermore, cultural differences in appreciation preferences should be considered to ensure recognition resonates with all employees. Finally, building a successful recognition program requires sustained effort and commitment from leadership.
One valuable resource for exploring innovative staff appreciation ideas is this article: Learn more about Employee Recognition Frequency.
Employee recognition frequency is a powerful employee engagement KPI because it directly addresses the fundamental human need for appreciation. When implemented thoughtfully and strategically, recognizing employees for their contributions not only boosts morale and engagement but also drives performance and strengthens the overall organizational culture. By making employee recognition a core component of their engagement strategy, organizations can create a positive and productive work environment where employees feel valued, motivated, and empowered to succeed.
7 Key Employee Engagement KPIs Compared
| KPI | Implementation Complexity 🔄 | Resource Requirements ⚡ | Expected Outcomes 📊 | Ideal Use Cases 💡 | Key Advantages ⭐ |
|---|---|---|---|---|---|
| Employee Net Promoter Score (eNPS) | Low - Single question survey, easy rollout | Minimal - Short surveys, low time investment | Measures employee loyalty and satisfaction clearly | Quick pulse checks on engagement, benchmarking | Simple, quick, good trend tracking |
| Employee Turnover Rate | Low - Calculated from HR data | Minimal - Requires HR data tracking | Indicates retention issues and recruitment impact | Long-term workforce stability and retention analysis | Clear financial insight, actionable |
| Employee Absenteeism Rate | Low to Medium - Requires attendance tracking | Moderate - Needs accurate absence recording | Early warning for engagement and health issues | Monitoring wellbeing and productivity | Early problem detection, productivity link |
| Internal Promotion Rate | Medium - Data from HR systems, requires tracking promotions | Moderate - Needs developmental program support | Shows career development & succession planning success | Talent pipeline management, leadership growth | Boosts retention, reduces hiring costs |
| Employee Satisfaction Score | Medium to High - Comprehensive surveys required | Moderate to High - Time and effort for broad surveys | Holistic view of employee experience and priorities | Deep organizational health insights and prioritization | Detailed, identifies specific areas |
| Manager Effectiveness Score | High - Multi-source feedback, cultural readiness needed | High - Time and resources for 360 reviews and coaching | Links manager behavior to engagement and team outcomes | Leadership development and retention efforts | Direct feedback, accountability, improves teams |
| Employee Recognition Frequency | Low - Track recognition events regularly | Low to Moderate - Recognition platforms or manual tracking | Improves motivation, engagement, and culture | Enhancing motivation and reinforcing culture | Inexpensive, scalable, boosts morale |
Driving Success Through Engaged Teams
Monitoring employee engagement KPIs like eNPS, turnover rate, absenteeism, internal promotion rate, employee satisfaction, manager effectiveness, and recognition frequency offers invaluable insights into the health of your organization. By understanding and actively managing these metrics, you gain a clear picture of your workforce's sentiment and can identify areas for improvement. This data-driven approach empowers you to make informed decisions, leading to increased productivity, higher retention rates, and a more positive work environment. For businesses undergoing significant changes like mergers or acquisitions, ensuring a smooth transition is critical for maintaining employee engagement. Mastering these employee engagement KPIs is essential not just for HR professionals, but for all leaders who understand that a thriving workforce is the cornerstone of a successful business. Invest in your people, and watch your business flourish.
Ready to transform your approach to employee engagement? Happily.ai helps you track and analyze these crucial KPIs, providing actionable insights to boost employee morale and performance. Visit Happily.ai today to learn more and discover how you can build a happier, more engaged team.